This post is a teaser for van den Bergh, D., Clyde, M. A., Raj, A., de Jong, T., Gronau, Q. F., Marsman, M., Ly, A., and Wagenmakers, E.-J. (2020). A Tutorial on Bayesian Multi-Model Linear Regression with BAS and JASP. Preprint available on PsyArXiv: https://psyarxiv.com/pqju6/
Abstract
Linear regression analyses commonly involve two consecutive stages of statistical inquiry. In the first stage, a single ‘best’ model is defined by a specific selection of relevant predictors; in the second stage, the regression coefficients of the winning model are used for prediction and for inference concerning the importance of the predictors. However, such second-stage inference ignores the model uncertainty from the first stage, resulting in overconfident parameter estimates that generalize poorly. These drawbacks can be overcome by model averaging, a technique that retains all models for inference, weighting each model’s contribution by its posterior probability. Although conceptually straightforward, model averaging is rarely used in applied research, possibly due to the lack of easily accessible software. To bridge the gap between theory and practice, we provide a tutorial on linear regression using Bayesian model averaging in JASP, based on the BAS package in R. Firstly, we provide theoretical background on linear regression, Bayesian inference, and Bayesian model averaging. Secondly, we demonstrate the method on an example data set from the World Happiness Report. Lastly, we discuss limitations of model averaging and directions for dealing with violations of model assumptions.
Example: World Happiness Data
To showcase Bayesian multi-model inference for linear regression we consider
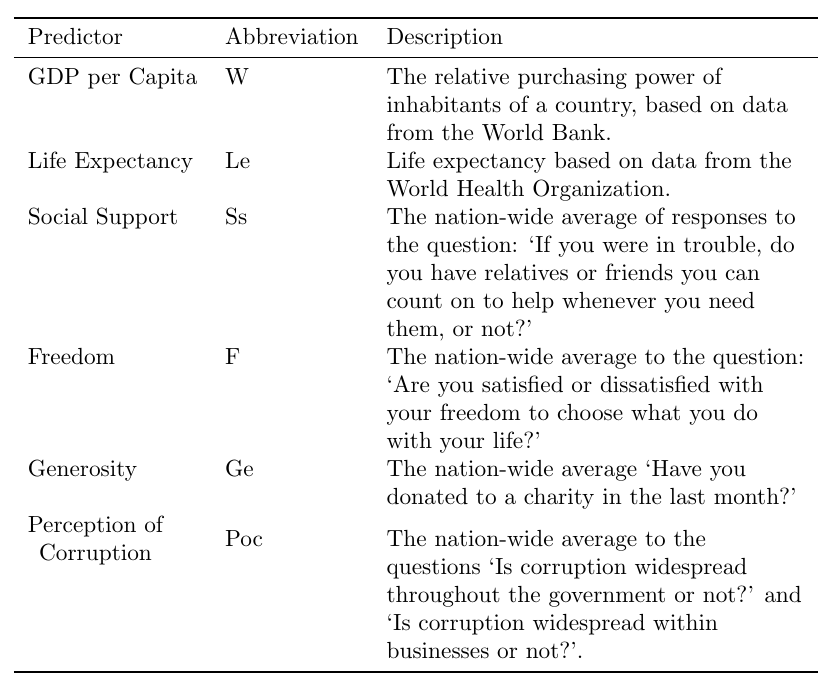
data from the World Happiness Report of 2018. We want to explain the average Happiness of a country using a set of predictors detailed below:
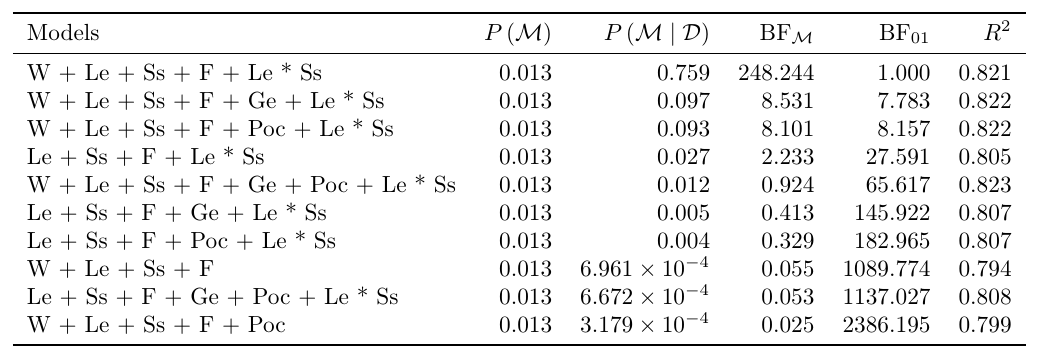
Using the Bayesian Linear Regression in JASP, which is powered by the R package BAS (Clyde, 2020), we observe that the following 10 models perform best.
The 10 best models from the Bayesian linear regression for the World Happiness Data. The leftmost column shows the model specification, where each variable is abbreviated as in the Table above. The second column gives the prior model probabilities; the third the posterior model probabilities; the fourth the change from prior to posterior model odds; the fifth the Bayes factor of the best model over the model in that row; and the last the R2 , the explained variance of each model.
Rather than making an all or nothing decision for a single model, Bayesian model averaging allows us to examine the aggregate results. That is, we weigh the parameter estimates of each model by the posterior model probability and obtain a weighted average that accounts for the uncertainty across models.
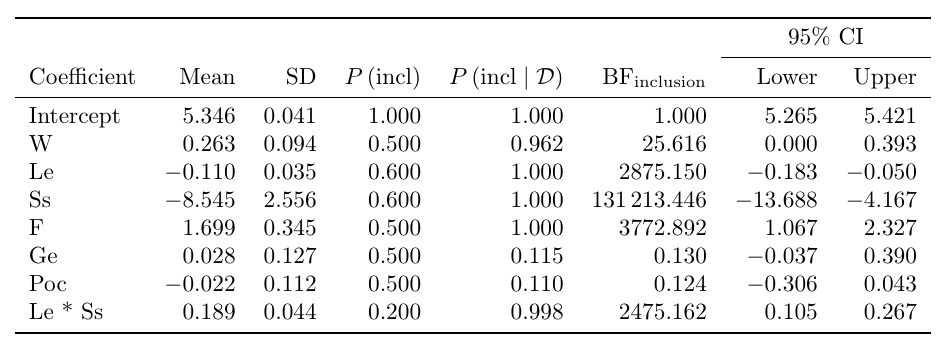
The result is a model averaged posterior distribution over parameters. We can summarize this distribution in a table,
Model-averaged posterior summary for linear regression coefficients of the World Happiness Data. The leftmost column denotes the predictor. The columns ‘mean’ and ‘sd’ represent the respective posterior mean and standard deviation of the parameter after model averaging. P (incl) denotes the prior inclusion probability and P (incl | data) denotes the posterior inclusion probability. The change from prior to posterior inclusion odds is given by the inclusion Bayes factor (BFinclusion ). The last two columns represent a 95% central credible interval (CI) for the parameters.
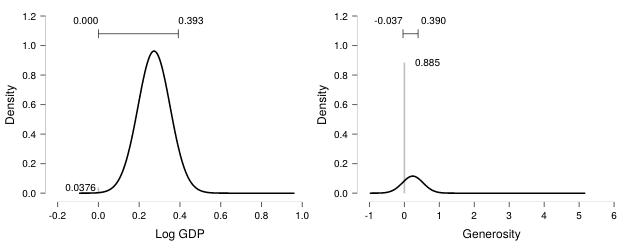
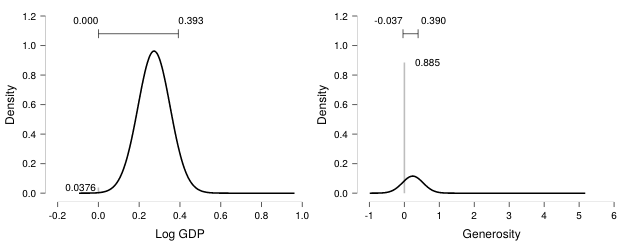
Or display the density in a figure:
The model-averaged posterior of Wealth expressed in GDP (left) and Generosity (right). In the left panel, the number in the bottom left (~0.03) represents the posterior exclusion probability. In the right panel, the posterior exclusion probability is much larger (~0.89). In both panels, the horizontal bar on top represents the 95% central credible interval. Figures from JASP. For details see the preprint.
References
van den Bergh, D., Clyde, M. A., Raj, A., de Jong, T., Gronau, Q. F., Marsman, M., Ly, A., and Wagenmakers, E.-J. (2020). A Tutorial on Bayesian Multi-Model Linear Regression with BAS and JASP. Preprint available on PsyArXiv: https://psyarxiv.com/pqju6/
Clyde, M. A. (2020) BAS: Bayesian Variable Selection and Model Averaging using Bayesian Adaptive Sampling, R package version 1.5.5 Package available from CRAN: https://cran.r-project.org/package=BAS
About The Authors
JASP Team
We’re the JASP Team!
